When React came on the scene it all of a sudden became easier to create complex frontend applications with minimum consideration for performance. This is all thanks to React’s virtual DOM, which manages our component tree and interacts with the browser’s DOM, adding, removing, or altering elements from it.
Wait, this doesn’t mean that writing a React application will resolve and remove all performance issues. These issues come up as a result of misunderstandings of the component’s lifecycle, bad design, or writing complex components without optimizing them.
React DevTools to the rescue 🚀
Setting up
First thing first, make sure that on whatever browser you are using, React DevTools extension is installed.
Once you’re all set up, let’s look at the example below.
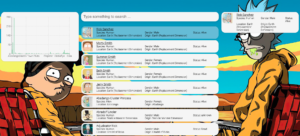
We are focusing on a simple project that pulls characters from the Rick and Morty REST API and presents them.
Let’s deep dive into the two main features that will help us understand how to improve our components.
Components
The Components tab presents the ability to watch and manipulate our React component tree.
Clicking the Components tab under your browser’s dev tools will open the following window:
Selecting a specific component from the component tree on the left panel will load the right one with relevant information and possible actions. In the right-hand side panel, you’ll be able to alter the component’s state and the component will react accordingly.
To test and debug a specific component, make sure you get to know the icon buttons located on the top right-hand side.
![]()
These buttons allow you to suspend a component (if you are using Suspense), focus on its DOM element, log the component data to the console or get to the component’s definition on your code.
Great. Got it.
But how does that help me optimize my components? And what do optimized components even look like?
Let’s start with the basics: a component should be kept under 16ms, to fit today’s monitors that refresh at a rate of 60Hz (calculating milliseconds will be 1000/60 = 16.66). Also, the human eye will perceive a good non-laggy animation when it has 60fps.
Once we’ve got our component size right, let’s move on.
Profiler
Helps us locate pitfalls and points out areas in our program that need improving.
Settings
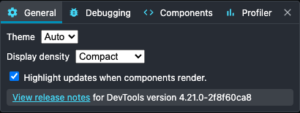
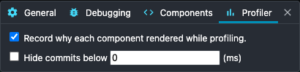
Before we dive in, let’s make sure that two options are checked under the React Developer Tools settings:
– Highlight updates when components render (General)
– Record why each component rendered while profiling (Profiling)
You’ll also find other settings such as filtering irrelevant components from the view, debugging options, and profiling options.
Now, the browser will highlight the components that are being rerendered whenever we are interacting with our application.
We can already see that clicking on a component will affect that component alone, but the actual result is that all the other components are being rendered as well.
Profiling
Profiling your application means that you can record your component tree behavior for a required period of time and see how they performed.
Let’s click on a result once again but this time profile it.

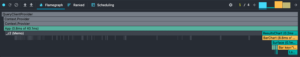
What we are seeing here is a graph of our components that were affected by this action.
Next to each, we see the total time that the render took (including the render time of its children).
There are two possible views:
– Flamegraph – shows us the rendering timeline.
– Ranked – order the components by render time.
In the example above, we can see the entire App component took about 200ms to render. Way too long for our taste. So let’s try something else.
In order to understand how to improve performance, you’ll have to know the code.
Let’s look at three components of this code: App, Results, and Result.
Memoizing callbacks
Awesome! You’re all caught up.
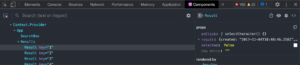
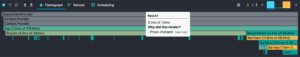
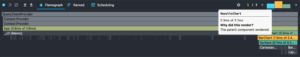
After profiling, we can hover/click on a component, and there we will see the “why did this render?” section.
We can tell that the cause of all the Result renders is the onClick prop that is passing all the way from our App component.
As we know, the selectCharacter function, declared on the App component will be recreated on each rerender. (read up on React component lifecycle and React hooks if you don’t know the reason).
We need to tell React not to recreate this function each time, it has no dependencies that need to be changed and is not using any closure.
Lucky for us React has a built-in hook called useCallback that will do just that.
Rewriting the function declaration will lead us to:
But wait, even after that we don’t see any significant improvement in our rendering time.
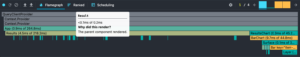
The Result components are all being rendered again but this time the reason is different. This time the parent component was rerendered as well (notice that the App component state was changed and that triggered the rendering).
Memoizing values
To fix that we need to make our Results component a Pure Component in our case we will achieve that using React.memo, and wrapping both Results and Result components.
By doing so we are telling react to trigger the component’s render only if its state or props changed.
Profiling our app again, we’ll see a significant change in our performance. Finally!
Now, we can see that the Chart that we are generating is also being rerendered.
That’s because looking at our code we see that the chartData is being calculated on each render.
To fix that we have another built-in hook called useMemo that allows us to define variables that are memoized and will be changed only when their dependencies are being changed.
Our profiling result is much much better, we can also add React.memo to our ResultsChart so it won’t be affected every time the App is being rendered.
Summary
The React Developer Tools helps us understand our app lifecycle a bit better and might help in fixing performance issues.
For that reason alone, consider profiling your app every now and again to get the best user experience that your application can provide.